A performance audit is a thorough review of an existing website in terms of loading speed and resource usage. It helps you identify potential problems and opportunities for optimization. A performance audit can also be used as a checklist when developing a new website. It ensures that all important aspects are considered from the start.
To learn more about why performance is a factor in search engine optimization and how it affects a website's ranking, read our SEO audit article.
Tools & Resources
The main toolset needed for performance testing is Chrome DevTools. It comes preinstalled in Chrome by default and can be opened with the F12 key. Alternatively, you can use the developer tools of Firefox, Edge and other browsers. Our performance audit is tailored to the widely used Chrome DevTools.
Google's Search Console provides additional insight into a site's performance metrics collected over time. We also use PageSpeed Insights from Google, Pingdom Website Speed Test from Solarwind, and tools from KeyCDN for synthetic analysis.
High-performance hosting for WordPress
The type of hosting chosen for a website can have a significant impact on loading times. Shared hosting is a common hosting option, especially for smaller websites and blogs, and one of the most common causes of poor performance.
With shared hosting, multiple websites share the same server resources, such as CPU, RAM, and disk space. This can affect a website's performance if other websites on the same server suddenly consume more resources. Loading times are often subject to fluctuations that you cannot directly control.
To avoid the performance issues associated with shared hosting, you should consider dedicated or managed hosting solutions. Dedicated servers provide a website with exclusive resources and full control, while managed hosting plans usually allow for optimized server configurations. There are also hosters that have dedicated their infrastructure and features to WordPress.
Caching plugins for WordPress
Caching plugins are a key component for improving the performance of WordPress websites. They offer a variety of useful features that reduce website load times and improve the user experience.
Some of the most important features include
- Page caching: Caching plugins store static versions of dynamically generated pages to reduce server overhead for repeated requests. This speeds up load times for returning visitors by eliminating the need for the server to generate a new page.
- Browser Caching: This feature allows web page resources such as images, CSS, and JavaScript files to be stored in the user's browser. This reduces the number of HTTP requests and the bandwidth required, resulting in faster load times.
- Shrink and merge files: Caching plugins compress CSS and JavaScript files by removing unnecessary characters and merging multiple files. This results in a smaller file size and fewer HTTP requests. However, since the introduction of HTTP/2, this practice has become inadvisable: a new, large merge of CSS and JS files is generated for each page, rendering caching virtually useless. Merging seems to primarily affect PageSpeed and similar tools, as they only look at individual pages, not the whole site. Otherwise, the problem of ineffective merging would be criticized. Therefore, we recommend not to enable file merging.
The quality and feature set of caching plugins can vary widely. Caching plugins like Borlabs Cache provide users with a wide range of features right out of the box, making optimization much easier.
Content Delivery Networks (CDN)
A content delivery network (CDN) is a network of servers located around the world that delivers content - such as images, scripts, stylesheets, and other static files - to website visitors more quickly. Using a CDN for WordPress can improve load times and reduce server load by redirecting requests for static content to the CDN servers.
However, a CDN is not necessary for most website owners. A CDN is usually only worthwhile if you have visitors from distant countries or if large media files, such as videos, are served through the server. If you host your website in Germany and expect most of your traffic to come from Western Europe, you will not need a CDN.
There are several ways to use a CDN in a WordPress website. One simple method is to use a caching plugin like Borlabs Cache. Setting up a CDN is usually done by making adjustments to the DNS so that a specific domain is routed through the CDN.
Benefits of CDNs:
- Faster load times and better user experience
- Reduced load on the origin server
- Increased security and reliability
- Instant availability of content
Disadvantages of CDNs:
- Additional costs, as CDN services, are typically fee-based.
- The potential complexity of setup and management
- With some CDNs, caching strategies can cause inconsistencies in the content displayed if not configured properly.
- Without additional monitoring, little control over what is actually displayed
Performance Monitoring Tools for WordPress
There are numerous website monitoring vendors that offer continuous monitoring of performance metrics. These services provide 24/7 monitoring of a website by periodically performing pings and page views, and measuring response and load times. However, these services are often expensive.
Web analytics software such as Google Analytics or Matomo, which are primarily used to measure traffic, can also provide important performance metrics. Matomo, for example, captures many metrics related to website performance by default.
Core Web Vitals
Core Web Vitals are a set of performance metrics introduced by Google to evaluate the quality of user experience on web pages. They are part of search engine optimization (SEO) because they can affect the ranking of web pages in Google's search engine results pages (SERP).
The Core Web Vitals consist of three main metrics:
- Largest Contentful Paint (LCP): LCP measures the load time of the largest visible content on a page. It provides information about how quickly a page is accessible to the user. A good LCP value is less than 2.5 seconds.
- First Input Delay (FID): FID measures the time it takes to respond to the first user interaction (such as a click, tap, or keystroke) on a page. A good FID value is less than 100 milliseconds and indicates how quickly a page becomes interactive.
- Cumulative Layout Shift (CLS): CLS measures the visual stability of a page by quantifying unexpected layout shifts during loading. A good CLS score is less than 0.10 and helps ensure that content does not suddenly shift on the page, affecting the user experience.
Core Web Vitals are collected from real users and reported separately for desktop and mobile. Together, these metrics provide insight into a website's speed, responsiveness, and stability. Compliance with Core Web Vitals improves the user experience, increases the likelihood that users will stay on the site, and can lead to higher rankings in search results.
Preparation of the performance audit
For the most reliable results, make sure that your computer is connected to the LAN and that your Internet connection is stable.
During the performance audit, it is important to view the site from a visitor's perspective to avoid skewing the results. You should be logged out of the WordPress backend, as the output may differ between logged-in and logged-out users. It's best to use a private browser window or incognito mode.
If you don't already use a caching plugin like Borlabs Cache or WP Rocket, you should install and configure one now. Such a plugin helps to unlock the full performance potential of the site.
During the performance audit, you should document the actual state of load times and run tests continuously to quantify and validate performance improvements or degradation after changes. By archiving the results, you can create your own benchmarks for future comparisons and evaluations of different optimization measures (such as trying different caching plugins).
Performing the Performance Audit
Synthetic review
For the synthetic review, we use free tools. Unlike the manual review, we get ratings and recommendations from the service itself. This gives us a good overview of the current state of the website. Later on, we will present the manual review as a solution that allows for deeper insights.
Google Search Console
If the site is connected to Google Search Console, you should review the performance metrics available there. Search Console collects data over a long period of time, providing important information about the site's performance and can highlight user experience and technical issues.
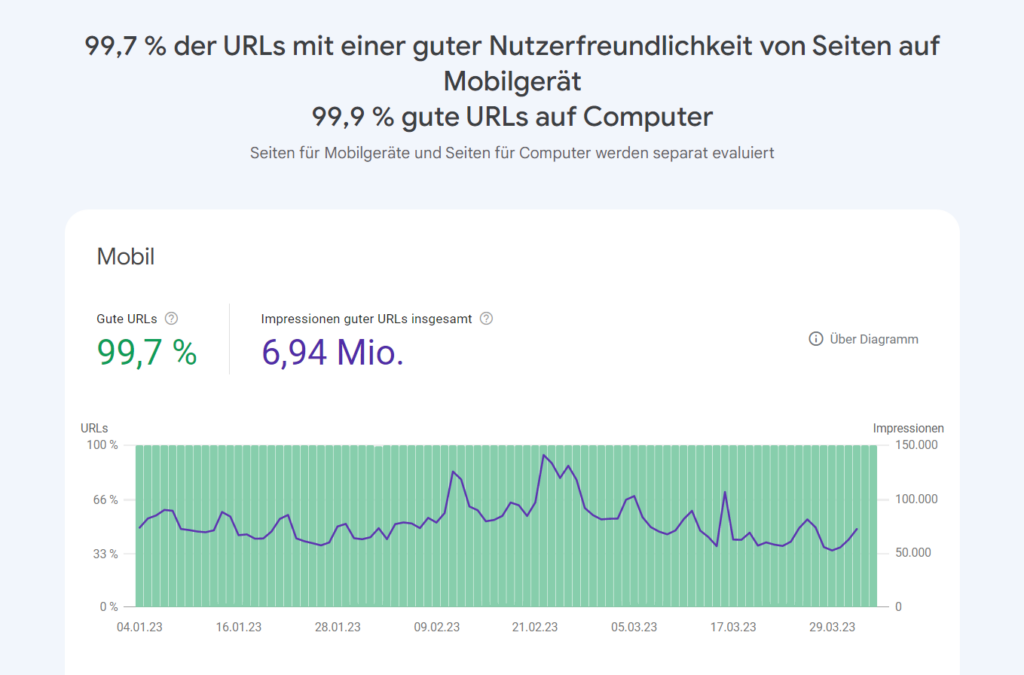
How-to: Navigate to the Usability tab in Search Console. Review and evaluate the metrics and notes from the Page Behavior, Core Web Vitals, and Mobile Usability menu items.
PageSpeed Insights
PageSpeed Insights is a tool from Google that analyzes a website's performance on mobile devices and desktops separately and provides optimization suggestions. The results are presented in two categories:
- Field Data (Core Web Vitals): Field data is real user data from the Chrome User Experience Report (CrUX). It includes the Core Web Vitals - Largest Contentful Paint (LCP), First Input Delay (FID), and Cumulative Layout Shift (CLS) - that are critical to a good user experience. Field data can only be collected when there is sufficient traffic on the site.
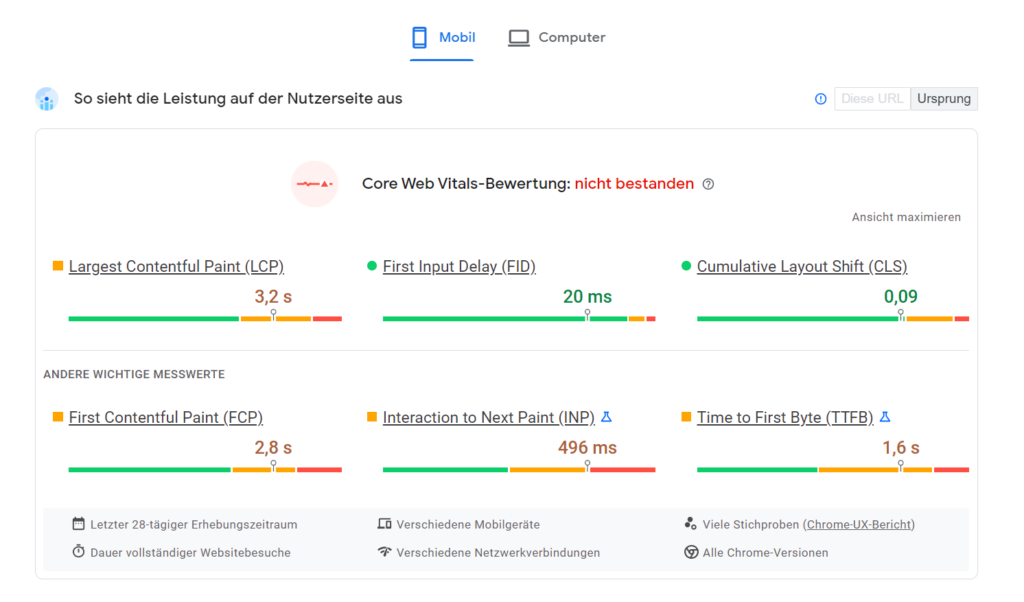
- Lab Data: Lab measurements are synthetic tests performed in a controlled environment. They are used to identify performance problems and evaluate optimization opportunities. The resulting score (0-100) gives an indication of the website's performance, but should only be used as a guide and is not a final assessment, as it can be distorted by questionable weighting. Much more important are the individual metrics, recommendations, and diagnostic statements.
How-to: Review the site using PageSpeed Insights. Evaluate the metrics and notes for field data (if available) and lab measurements.
Pingdom Website Speed Test
Pingdom Website Speed Test is another synthetic performance check tool that analyzes load times and provides performance metrics. It provides a detailed waterfall analysis of loaded resources, shows the total page size and the number of requests. The Pingdom score (0-100) is also only a guide and does not provide a final assessment.
How-to: Check the website with the Pingdom Website Speed Test. Evaluate the metrics and tips.
Evaluation of the results
When evaluating and interpreting the results from PageSpeed Insights and Pingdom Website Speed Test, keep the following in mind:
- Compare the results of both tools to get a complete picture of site performance.
- Look for recurring patterns or issues identified by both tools.
- Focus on the optimization suggestions that have the greatest impact on performance and prioritize them accordingly. Not every recommendation will be applicable to your project.
- Note that synthetic test results are for guidance only and do not provide a definitive assessment of real-world performance. Manual measurements, real user data, or field data are critical for a comprehensive assessment of site performance.
Possible recommendations from PageSpeed Insights and Pingdom Website Speed Test include
- Reduce server response time (Time To First Byte, TTFB): A long server response time can result in delayed page rendering. Optimize server configuration, reduce database queries, and use caching to reduce response time.
- Eliminate resources that block rendering: JavaScript and CSS resources can delay page rendering. Reduce resources or load them asynchronously to speed up page rendering.
- Optimize images: Large images can significantly increase page load time. Recommendations may include compressing images, choosing a web-optimized format (such as WebP instead of JPEG or PNG), or using lazy loading techniques to load images only when they are actually needed.
- Prioritize visible content: Long pages with lots of content take longer to load. Prioritize visible content to show users important information as quickly as possible while the rest of the content loads in the background.

KeyCDN Tools
KeyCDN offers other helpful tools. Analyze and compare results with other sites.
Based on 10 locations worldwide, the Performance Test allows measurement of four key metrics:
- DNS measures the time it takes to query the Domain Name System.
- Connect measures the time taken to connect to the server.
- TLS shows the additional time taken for the TLS connection of each resource.
- Finally, TTFB measures the time it takes for a client to make an HTTP request and receive the first byte of data from the server.
The HTTP Header Checker can be used to check whether certain features, such as DNS prefetch and caching, are active and what server configuration is being used.
The Traceroute Test (tracert) is used to trace the route from a computer to the server. This is done by displaying a list of network devices that the packet passes through on its way to the server. This can be used to determine where delays occur, or if there are bottlenecks or congestion in the network.
Manual review
- Open Google Chrome in incognito mode to ensure that no browser data is skewing the results.
- Press F12 to open Chrome DevTools and navigate to the Network tab.
- Check the Disable Cache option to temporarily disable client-side caching.
- Visit the homepage of the website you want to analyze and also randomly analyze subpages, such as blog posts, as described below.
By disabling the cache, you simulate the first time the website is accessed from the user's point of view. To compensate for fluctuations and deviations in the measurement results, you should perform several test runs (Ctrl + F5) and only use the results that do not show any obvious deviations.
The footer of the Network tab displays important measurements for network analysis. Please note that the following guidelines and recommendations are only indicative and may vary depending on the type and size of your website. It is important to analyze the performance of your website individually and implement targeted optimization measures according to your specific needs and goals.
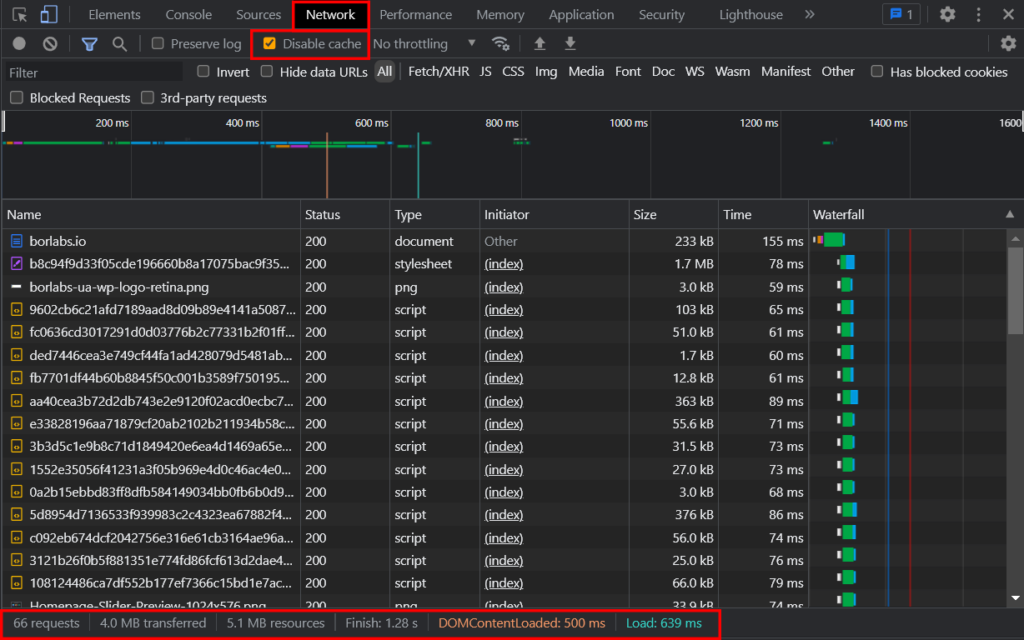
You should check the following readings (see the lower marker in the screenshot):
Requests: The total number of network requests made while a page is loading. This includes all files, images, scripts, and other resources requested by the page.
- Reference value: Less than 80 requests
- Recommendation: Reduce the number of network requests by aggregating resources, eliminating unnecessary requests, and implementing lazy loading for images and videos where appropriate.
MB transferred (over network): This value shows the actual amount of data in megabytes that was transferred over the network to load the webpage and all its resources. It also takes into account any compression (such as Gzip) used to transfer the resources.
- Reference value: Less than 4 MB
- Recommendation: Reduce the amount of data by compressing resources, optimizing images and videos, and using Gzip compression where appropriate.
MB Resources: This value indicates the total size of resources requested while the page was loading, in megabytes. This refers to the size of all downloaded resources (documents, scripts, stylesheets, images, etc.) without taking into account headers, cookies, and other metadata. It shows the actual size of the resources after they are decompressed on the client (e.g. in the browser).
- Reference value: Less than 5 MB
- Recommendation: Minimize resource size by removing unused scripts and stylesheets, optimizing code, and compressing resources.
Finish:
The time it takes to complete all network requests and fully download all resources. This value is in seconds and ends when the last resource is received. When resources are downloaded asynchronously, such as when a video is playing, the finish time continues even after the web page has finished loading.
- Reference value: Less than 3 seconds (without reloading resources).
- Recommendation: Reduce load time by optimizing resources, switching to higher-performance hosting, or using CDN solutions.
DOMContentLoaded: The time it takes for the DOM (Document Object Model) of the page to be built and ready for processing by scripts. This time is measured in seconds and ends when the browser window triggers the DOMContentLoaded event.
- Reference value: Less than 2 seconds
- Recommendation: Improve DOM readiness by prioritizing critical resources, avoiding render-blocking resources, and loading scripts asynchronously.
Load: The time it took to fully load the page, including all resources, images, and scripts. This value is in seconds and ends when the browser window fires the "load" event, indicating that all resources and scripts have been processed, and the page is fully loaded.
- Reference value: Less than 2.5 seconds
- Recommendation: Reduce the overall load time by implementing the above optimization measures and by continuously monitoring and adjusting the performance of your website.
Waterfall Graph
The Network tab also provides a waterfall graph (to the right of the Time column, see screenshot above) that visualizes the load times of individual resources, as well as the order and parallelism of requests.
This chart can help you determine whether performance problems are due to a large number of individual resources or to processing and network delays. The time to first byte (TTFB) is particularly important here.
Categorization
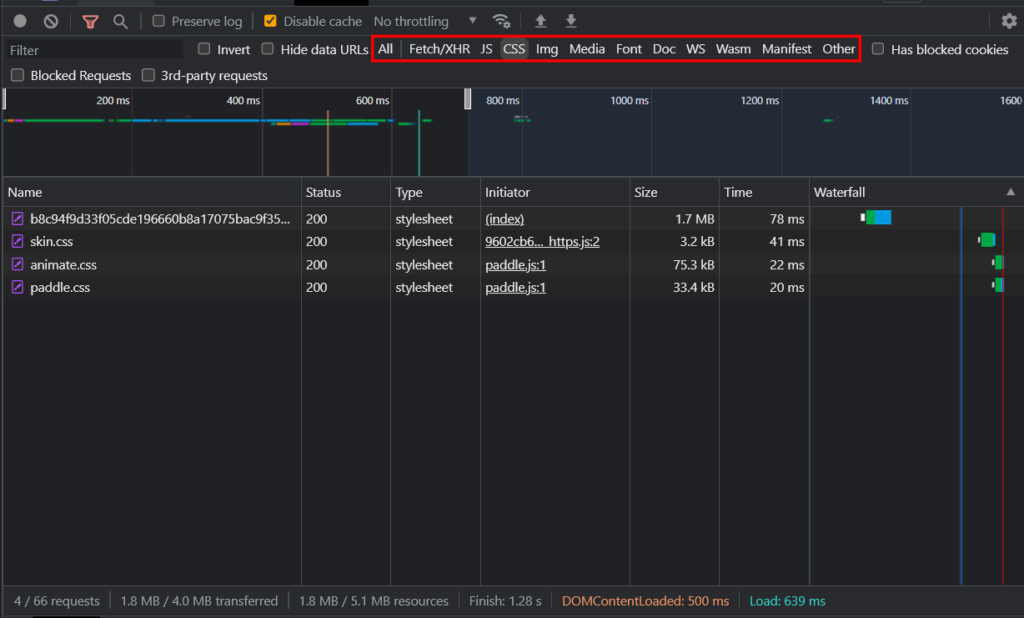
You can filter the loaded resources by various categories. This simplifies analysis and allows you to examine specific types of resources. The categories include
- Fetch/XHR: Fetch requests and XMLHttpRequests (XHR) are displayed here. These are usually API calls or asynchronous requests made by JavaScript to retrieve or submit data from the server.
- JS: This category displays all JavaScript files loaded by the web page.
- CSS: Displays all loaded Cascading Style Sheets (CSS) files.
- Media: Lists all loaded media resources such as images, videos, and audio files.
- Font: This category lists all loaded fonts (web fonts) used to display text on the web page.
- Doc: Lists all HTML documents, including the main page and any embedded iframes.
- WS: Displays WebSocket connections. WebSockets allow real-time, bidirectional communication between the client (browser) and the server.
- Wasm: Displays WebAssembly modules. WebAssembly is a form of binary code that can be executed by modern browsers and provides fast performance for web applications.
- Manifest: This category displays the web application manifest used by Progressive Web Apps (PWA).
- Other: Displays all resources that do not fall into the categories above. For example, this can include text or JSON files.
Simulate throttling
The throttling feature in Chrome DevTools allows you to simulate the network and CPU speed available to users with a slower connection or less powerful device. This feature gives you a realistic picture of how your site will load for users with a range of connection speeds and device capabilities beyond powerful desktop PCs and DSL connections.
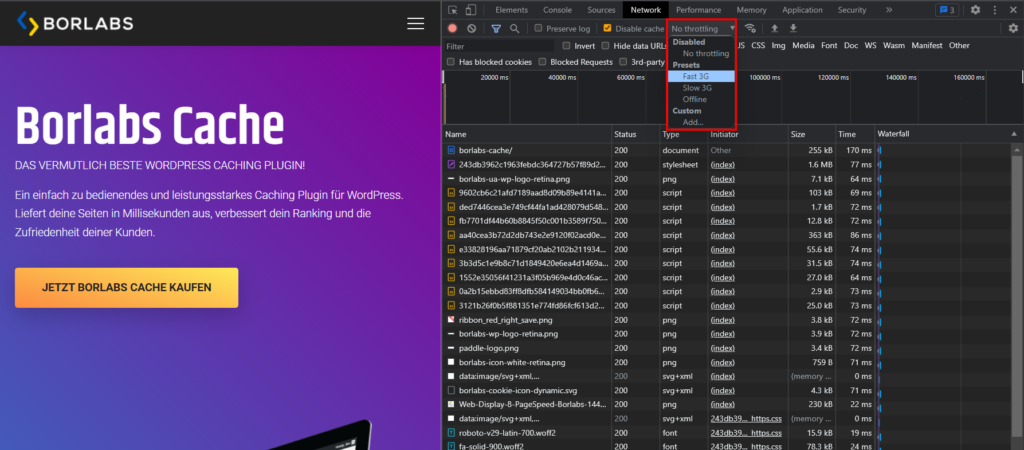
How-To: To enable throttling, open Chrome DevTools, click the Network tab, and select one of the available presets (such as Fast 3G or Slow 3G) from the Throttling drop-down list. You can also create a custom throttling rate by clicking "Add…" and entering the desired values. CPU throttling can be set in the Performance tab by clicking the gear icon and selecting the desired CPU throttling rate.
Simulate device resolutions
The Device Toolbar in Chrome DevTools allows you to simulate your website on different devices and screen sizes. This can help you identify and resolve potential performance or display issues on mobile devices or tablets.
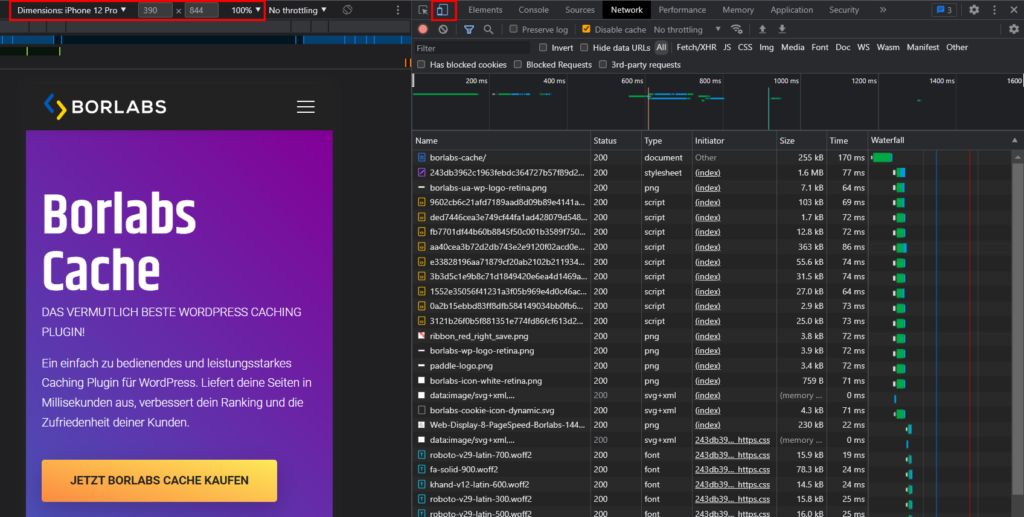
How-to: To enable the Device Toolbar, open Chrome DevTools and click the device icon (a small smartphone and tablet icon) in the top left corner. A toolbar will appear at the top of the browser window, where you can select different devices from a drop-down list (for example, "iPhone 12 Pro" or "Pixel 5"). You can also add custom devices and screen sizes by clicking "Edit…" and entering the desired values. During the simulation, you can change the orientation of the device (portrait or landscape), adjust the zoom level, and apply network and CPU throttling if necessary to create more realistic test conditions.
Media content
Images and video are critical elements of an engaging website, but they can also have a significant impact on performance. As they are often the largest resource consumers, it is important to consider and optimize them separately. While videos are typically asynchronously reloaded, images are typically fully loaded on page load, which can lead to unnecessary load delays.
An effective way to improve image loading time is to use lazy loading. This means that images are only loaded when they are actually visible to the user.
For optimal performance, images should also be compressed and served in the correct format.
Make sure your site uses larger images for desktop views and smaller images for mobile views. Take note of the image recommendations that PageSpeed Insights provides.
Another important consideration is image compression. Reducing the file size without noticeably affecting the quality of the image can significantly reduce load time. For WordPress, there are several plugins and services that can help with image optimization. They automatically compress images and often offer additional features, such as automatically generating WebP images or resizing images for different devices and resolutions.
Third-party resources
If you run a WordPress site that does not use third-party embeddings, you can already achieve excellent performance results with a good caching plugin (such as Borlabs Cache). Things get more difficult when third-party resources are embedded and need to be loaded from external servers. In such cases, optimization options are limited because you cannot optimize external resources directly. Examples of third-party integrations include YouTube videos, fonts, and Google Analytics.
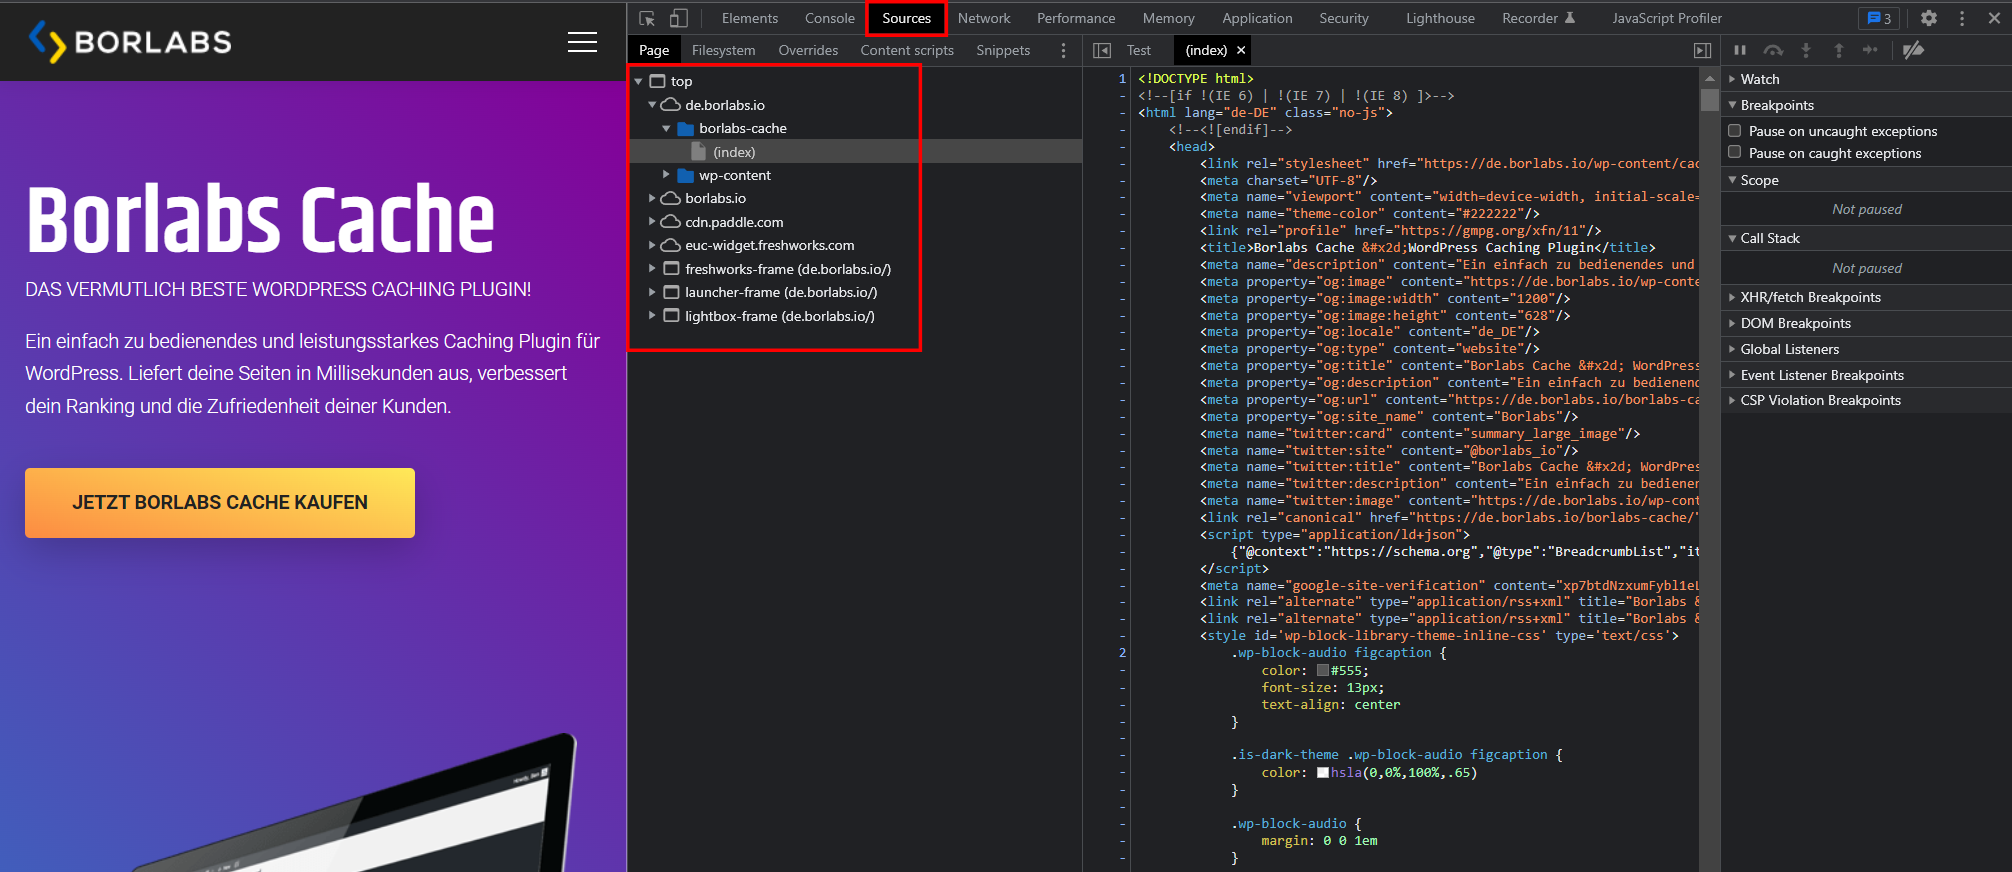
How-to: To identify third-party connections, use Chrome DevTools again. This time, navigate to the Sources tab. You will see a list of all connections and loaded resources, including those from third-party vendors. You can use the Network tab to analyze load times and other information about each resource in more detail.
While your options are generally limited with external resources, there are some optimization options you can consider to improve the performance of third-party content:
- Consider whether embedding is really necessary, or whether it can be reduced by using local solutions. If possible, load external resources such as fonts or scripts locally on your server and embed them from there to reduce dependency on external servers.
- Prioritize external resources: Evaluate the importance of each external resource and rank them by priority. For low-priority resources that are not essential to the initial rendering of the page, you can move the embedding to the footer, for example. For high-priority resources, such as fonts, you can use the "preload" attribute to instruct the browser to download and cache them in advance so that they are available more quickly when they are actually needed. You can also do this with a WordPress plugin you've developed yourself.
- Block external resources with a cookie banner: When external resources like social media plugins or analytics tools set cookies, you can use a consent plugin to delay their execution until the user has given their consent. This reduces the number of initially loaded resources and improves performance.
- DNS Prefetching: With DNS prefetching, the browser performs DNS requests for external resources in advance, before they are actually needed. This can reduce the delay that normally occurs during DNS resolution, thus reducing the load time of included resources. Borlabs Cache supports DNS prefetching.
Optimize backend
Up to this point, we have mainly focused on analyzing and optimizing the frontend. In this chapter, we turn our attention to the WordPress backend.
Updates
Remove unneeded plugins regularly, and keep both WordPress and the plugins you do use up to date. Unnecessary or outdated plugins can lead to security vulnerabilities and performance issues. Make sure you are running the latest version of PHP on your server.
Database optimization
Over time, database tables can become cluttered and inefficient, especially if you install and uninstall a lot of plug-ins or make frequent changes to your site.
Removing unnecessary and outdated data can make the database work more efficiently. You can use a plugin like Borlabs Cache to automate this process. Borlabs Cache can clean up and reduce the size of your database, making the system perform better.
WP Cron jobs
Cron jobs are scheduled tasks that run automatically in the background to perform recurring actions such as publishing scheduled posts, updating feeds, or running regular backups. WordPress has a built-in system called WP-Cron that provides cronjob-like functionality. However, WP-Cron is triggered every time a page is loaded, which can lead to performance issues, especially for high-traffic or compute-intensive tasks.
The advantage of using a true cronjob (i.e. system-controlled cronjobs) is that the scheduled tasks are executed independently of page loads, improving performance and reliability.
To implement a true cronjob on WordPress, WP-Cron must be disabled by an entry in wp-config.php and then replaced with a system-driven cronjob via the web host's control panel.
Server side caching
Server-side caching solutions such as LiteSpeed, Varnish, and Redis provide an efficient way to improve website performance by storing frequently requested data in the server cache.
Compared to caching plugins for WordPress that work at the application level, server-side caching solutions can provide faster and more efficient content delivery because they work closer to the source (the web server). This results in reduced server load and better scalability for high traffic. In addition, server-side caching solutions are often better able to handle dynamic content efficiently, which can be especially beneficial for complex WordPress websites.
